Recap: U.S. economic growth decelerated to a 1.1% annual rate in the first quarter of 2023 as consumers faced high inflation, rising interest rates, and the onset of banking problems. The rise in U.S. Gross Domestic Product (GDP) in the year's first three months marked a slowdown from the inflation and seasonally adjusted 2.6% growth in the fourth quarter. Solid consumer spending drove the first-quarter increase, while a slowdown in business investment and a decline in housing investment offset growth.
The U.S. economy has been at an inflection point. Financial market conditions have generally stabilized over the last month after an initial tightening. It remains to be seen how recent developments in the banking sector could affect access to credit, although lending should stay tighter in the months ahead.
Data have shown some signs of economic slowdown. The goods sector has already corrected, and equipment spending should remain weak for the year. Consumer price inflation has remained stubbornly high but has shown signs of slowing. There have also been increased indications that the labor market would weaken from a very high starting point.
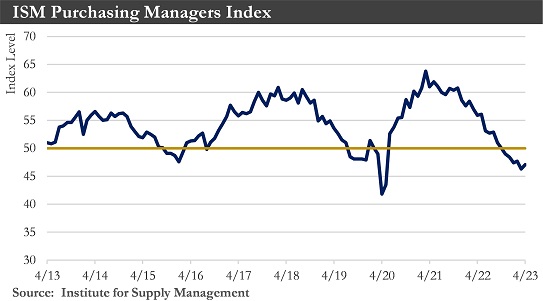
Beyond labor, there were growing signs of weakness elsewhere in the economy. Both ISM reports demonstrated an economic slowdown last month. The ISM manufacturing index gained some ground in April but is still in contraction territory and was consistent with a sector in correction for six straight months. At the same time, the services report, which fell slightly, called the sector’s resilience into question.
The full effects of the Fed’s interest rate hikes and tighter credit conditions will likely be realized later this year, setting the stage for weaker economic growth in the months ahead. Stricter bank lending prompted by the recent failure of multiple midsize American banks will also slow U.S. economic growth. U.S. banks’ lending capacity will likely decline by 1% this year due to the fall in the value of many bank stocks as investors reassess the health of mid-sized banks. That reduction in lending should shave about 0.5 percentage points off U.S. GDP in 2023.
Because regional and smaller banks in the United States have accounted for more than one-third of total bank lending, a reduction in credit availability could have a material impact on economic growth and financial stability.
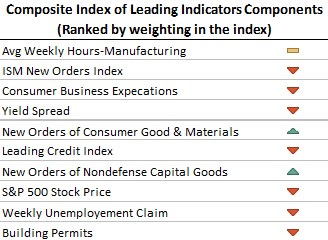
A mild recession in the year's second half remains likely. Early signs of labor market softening are one reason to believe that May’s interest rate hike will be the last. Jobless claims ticked up to 245,000 in April. Although still lower than pre-COVID norms, this upside surprise has shown a clear upward trend in layoffs since the start of the year. A 12-month slide in the Leading Economic Index (LEI) supports the view that the economy could fall into recession in the year's second half. The LEI dropped 1.2% in March, its sharpest monthly decline since April 2020. March’s decline was widespread, reflecting a weakening manufacturing sector, souring consumer sentiment, and building permit downshifts.
Real GDP growth: Real GDP expanded by 1.1% quarter-over-quarter (annualized) in the first quarter of 2023 – a marked deceleration from last quarter's 2.6%. A significant negative inventory swing offset strength in consumer spending in the first quarter.
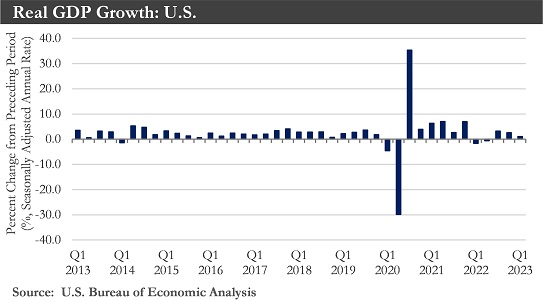
Much of the strength on the domestic front resulted from a solid reading on consumer spending. A sturdy labor market, alongside some easing in inflationary pressures, has helped to support real household incomes and sustain a robust pace of consumer spending.
But there has been some evidence of cooling in the labor market. At the same time, other higher-frequency data points have indicated a further softening in economic activity heading into the second quarter. These pressures should intensify over the coming months as the cumulative impact of higher interest rates and some tightening in bank lending standards exert a more significant drag on domestic demand, pushing growth to a near-stall speed as early as Q2.
Inflation: Consumer prices in March rose by the smallest amount in nine months thanks to a decline in energy costs and flat food prices. But inflation has continued to run well above the Fed's target, with the core CPI advancing 0.4% and remaining above 5% when measured on a three-month annualized basis.
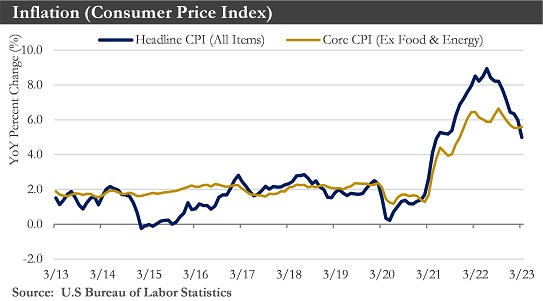
There have been forward-looking signs suggesting inflation will slow further in the coming months. Lower commodity prices, replenished inventories, and higher financing costs should help goods inflation ease further. Meanwhile, the pullback in the housing market has finally translated into slower shelter price growth. More generally, weaker demand for and greater labor supply has helped to reduce wage pressures. At the same time, deteriorating consumer finances have made it more difficult for businesses to pass on higher prices. However, with inflation —particularly in the service sector — continuing to carry strong momentum, a sustained return to 2% could remain a long way off.
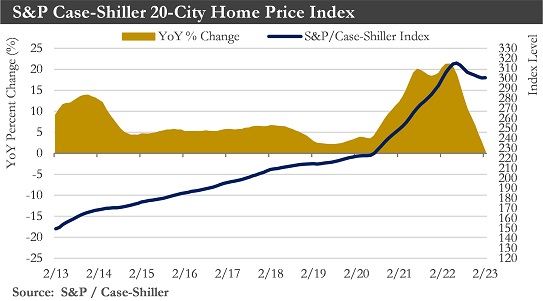
Housing Market: A batch of housing data has confirmed that a full-fledged housing market recovery is still far off. Existing home sales fell by 2.4% month-over-month in March, pulling back from February’s revised 13.8% month-over-month increase. Month-to-month changes have mirrored the volatility in mortgage rates as elevated prices have increased buyers' reliance on financing conditions. While median home prices declined for a third consecutive month relative to year-ago levels, the seasonally adjusted change between March and April would point to low inventory levels. The upturn in mortgage rates has been a factor in keeping resale inventory low, as rising financing costs have discouraged homeowners from putting their houses on the market. However, new home construction has picked up, with single-family housing starts recovering for a second consecutive month in March after eleven straight months of declines.
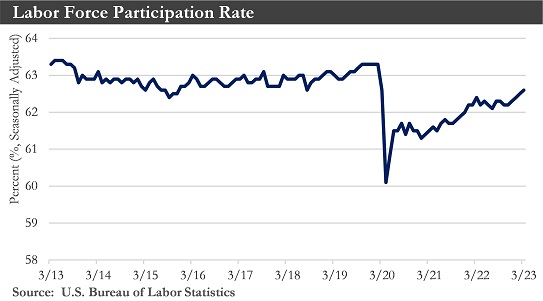
Labor market: Over the past month, data have delivered a more consistent message that the jobs market is cooling. Nonfarm payrolls in March rose by the smallest amount in more than two years; job openings lurched lower and annual revisions showed initial jobless claims on a clear upward trend in the past two months. Balance in the jobs market has improved not only through weaker demand but improving supply. The labor force participation rate rose for a fourth consecutive month in March, with the increasing pool of workers helping to soften the recent wage growth trend. The ratio of job openings to the unemployed also eased to 1.7. Both are nowhere near levels to suggest job losses are approaching, but the movement has captured an easing in demand for workers.
In an absolute sense, the labor market has remained strong. Hiring is still well above the last cycle's average, while the unemployment rate dipped to 3.5% last month. However, with the full effect of the Fed's tightening yet to be felt and corporate profits coming under increasing pressure, material weakening could be likely as the year progresses.
Monetary Policy: The Federal Reserve could be in the final stage of its current tightening cycle. Recent data should cause the Federal Open Market Committee (FOMC) to elect to hike its federal funds rate one more time by 25 bps at its next policy meeting on May 3rd. But since growth has already shown signs of slowing, the Fed will likely keep rates at a range of 5.00%-5.25% as it assesses the lagged effects of how tightening has translated to the real economy.
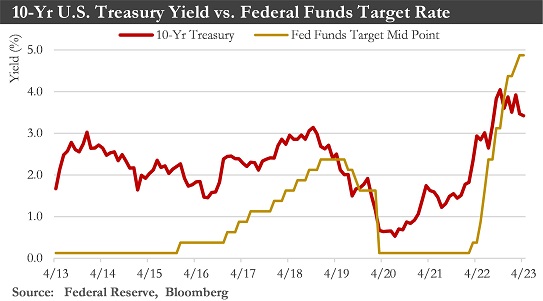
If, as expected, economic growth should start to slow later this year, the FOMC would begin to ease policy. The Committee would bring rates back down to a range of 2.25%-2.50% over the course of 2024 to return to a more neutral policy level, with inflation running slightly higher than an expected 2%.
U.S. Dollar: The U.S. dollar has experienced multiple crosscurrents that should result in a relatively stable currency through the end of Q2-2023. Longer term, if the Fed lowered interest rates more aggressively than peer central banks next year, this should place broad depreciation pressure on the dollar over the second half of 2023 and into 2024. Emerging market currencies could continue to experience widespread currency strength going forward should this happen, with the best opportunities existing within high-yielding currencies in Latin America and Emerging Europe.
Global Economy: Evidence has shown that global economic conditions have improved, and global growth has been slightly more robust than initially expected. The global economy should grow around 2% this year. Lower commodity prices and improving supply chain dynamics should see global inflation fall quickly, enhancing consumer purchasing power.
Core inflation in the Eurozone hit a record in March, a setback for central bankers whose rapid interest-rate rises have exacerbated financial sector strains and caused pain in part of the bloc’s economy. Consumer prices were 6.9% higher in March than a year earlier. This increases the likelihood that the European Central Bank will raise its key rate again in May. It could also encourage governments to explore alternative ways to cool price rises by targeting inflationary profit increases.
China’s economy rebounded in the first three months of 2023 after Beijing dismantled its heavy-handed Covid-19 controls, teeing up a revival in growth that could buoy the global economy as the U.S. and European economies slow. China's economy expanded by 4.5% in the first quarter of the year compared with the same three months a year earlier. Chinese consumers drove growth. The economy has also benefited from government investment in infrastructure and a surprise pickup in exports in March.
Outlook: The U.S. economy has continued to expand, albeit relatively sluggishly. Consumer spending, the primary driver of growth, and hiring were surprisingly strong at the start of 2023. Still, they more recently slowed as the Federal Reserve has continued raising interest rates to cool the economy and curb rapid price increases.
Consumers cut retail spending in February and March. Home sales and manufacturing output dropped in March, and robust hiring growth eased.
Fed tightening in May should exert further headwinds on the economy. Additionally, the cash stockpiles consumers have accumulated over the past few years are gradually being eroded. Real personal consumption expenditures will likely decelerate in the coming months, lowering headline GDP growth.
Growth could average about 1.3% in 2023 and just 1.0% in 2024. Weaker economic growth should soon begin to weigh on hiring intentions – putting upward pressure on the unemployment rate. The unemployment rate should rise by more than one percentage point between Q1-2023 and Q4-2024, reaching a peak of 4.5%-5.0%, before gradually moving back to its long-run average of 4%.
Inflation has slowed from its multi-decade highs, though more recent data has shown some stalling in the disinflation process. The fed funds rate could reach 5.25% in Q2-2023 and remain at that level through the fourth quarter of 2023. As higher rates cool demand-side pressures and inflation moves meaningfully back towards 2%, the Fed will be able to cut interest rates back to a level more consistent with its neutral (2.5%) rate.
Sources: Department of Commerce, Department of Labor, Bloomberg, Peoples Bank of China, Eurostat, Institute for Supply Management, National Association of Realtors
The U.S. economy has been at an inflection point. Financial market conditions have generally stabilized over the last month after an initial tightening. It remains to be seen how recent developments in the banking sector could affect access to credit, although lending should stay tighter in the months ahead.
Data have shown some signs of economic slowdown. The goods sector has already corrected, and equipment spending should remain weak for the year. Consumer price inflation has remained stubbornly high but has shown signs of slowing. There have also been increased indications that the labor market would weaken from a very high starting point.
Beyond labor, there were growing signs of weakness elsewhere in the economy. Both ISM reports demonstrated an economic slowdown last month. The ISM manufacturing index gained some ground in April but is still in contraction territory and was consistent with a sector in correction for six straight months. At the same time, the services report, which fell slightly, called the sector’s resilience into question.
The full effects of the Fed’s interest rate hikes and tighter credit conditions will likely be realized later this year, setting the stage for weaker economic growth in the months ahead. Stricter bank lending prompted by the recent failure of multiple midsize American banks will also slow U.S. economic growth. U.S. banks’ lending capacity will likely decline by 1% this year due to the fall in the value of many bank stocks as investors reassess the health of mid-sized banks. That reduction in lending should shave about 0.5 percentage points off U.S. GDP in 2023.
Because regional and smaller banks in the United States have accounted for more than one-third of total bank lending, a reduction in credit availability could have a material impact on economic growth and financial stability.
A mild recession in the year's second half remains likely. Early signs of labor market softening are one reason to believe that May’s interest rate hike will be the last. Jobless claims ticked up to 245,000 in April. Although still lower than pre-COVID norms, this upside surprise has shown a clear upward trend in layoffs since the start of the year. A 12-month slide in the Leading Economic Index (LEI) supports the view that the economy could fall into recession in the year's second half. The LEI dropped 1.2% in March, its sharpest monthly decline since April 2020. March’s decline was widespread, reflecting a weakening manufacturing sector, souring consumer sentiment, and building permit downshifts.
Real GDP growth: Real GDP expanded by 1.1% quarter-over-quarter (annualized) in the first quarter of 2023 – a marked deceleration from last quarter's 2.6%. A significant negative inventory swing offset strength in consumer spending in the first quarter.
Much of the strength on the domestic front resulted from a solid reading on consumer spending. A sturdy labor market, alongside some easing in inflationary pressures, has helped to support real household incomes and sustain a robust pace of consumer spending.
But there has been some evidence of cooling in the labor market. At the same time, other higher-frequency data points have indicated a further softening in economic activity heading into the second quarter. These pressures should intensify over the coming months as the cumulative impact of higher interest rates and some tightening in bank lending standards exert a more significant drag on domestic demand, pushing growth to a near-stall speed as early as Q2.
Inflation: Consumer prices in March rose by the smallest amount in nine months thanks to a decline in energy costs and flat food prices. But inflation has continued to run well above the Fed's target, with the core CPI advancing 0.4% and remaining above 5% when measured on a three-month annualized basis.
There have been forward-looking signs suggesting inflation will slow further in the coming months. Lower commodity prices, replenished inventories, and higher financing costs should help goods inflation ease further. Meanwhile, the pullback in the housing market has finally translated into slower shelter price growth. More generally, weaker demand for and greater labor supply has helped to reduce wage pressures. At the same time, deteriorating consumer finances have made it more difficult for businesses to pass on higher prices. However, with inflation —particularly in the service sector — continuing to carry strong momentum, a sustained return to 2% could remain a long way off.
Housing Market: A batch of housing data has confirmed that a full-fledged housing market recovery is still far off. Existing home sales fell by 2.4% month-over-month in March, pulling back from February’s revised 13.8% month-over-month increase. Month-to-month changes have mirrored the volatility in mortgage rates as elevated prices have increased buyers' reliance on financing conditions. While median home prices declined for a third consecutive month relative to year-ago levels, the seasonally adjusted change between March and April would point to low inventory levels. The upturn in mortgage rates has been a factor in keeping resale inventory low, as rising financing costs have discouraged homeowners from putting their houses on the market. However, new home construction has picked up, with single-family housing starts recovering for a second consecutive month in March after eleven straight months of declines.
Labor market: Over the past month, data have delivered a more consistent message that the jobs market is cooling. Nonfarm payrolls in March rose by the smallest amount in more than two years; job openings lurched lower and annual revisions showed initial jobless claims on a clear upward trend in the past two months. Balance in the jobs market has improved not only through weaker demand but improving supply. The labor force participation rate rose for a fourth consecutive month in March, with the increasing pool of workers helping to soften the recent wage growth trend. The ratio of job openings to the unemployed also eased to 1.7. Both are nowhere near levels to suggest job losses are approaching, but the movement has captured an easing in demand for workers.
In an absolute sense, the labor market has remained strong. Hiring is still well above the last cycle's average, while the unemployment rate dipped to 3.5% last month. However, with the full effect of the Fed's tightening yet to be felt and corporate profits coming under increasing pressure, material weakening could be likely as the year progresses.
Monetary Policy: The Federal Reserve could be in the final stage of its current tightening cycle. Recent data should cause the Federal Open Market Committee (FOMC) to elect to hike its federal funds rate one more time by 25 bps at its next policy meeting on May 3rd. But since growth has already shown signs of slowing, the Fed will likely keep rates at a range of 5.00%-5.25% as it assesses the lagged effects of how tightening has translated to the real economy.
If, as expected, economic growth should start to slow later this year, the FOMC would begin to ease policy. The Committee would bring rates back down to a range of 2.25%-2.50% over the course of 2024 to return to a more neutral policy level, with inflation running slightly higher than an expected 2%.
U.S. Dollar: The U.S. dollar has experienced multiple crosscurrents that should result in a relatively stable currency through the end of Q2-2023. Longer term, if the Fed lowered interest rates more aggressively than peer central banks next year, this should place broad depreciation pressure on the dollar over the second half of 2023 and into 2024. Emerging market currencies could continue to experience widespread currency strength going forward should this happen, with the best opportunities existing within high-yielding currencies in Latin America and Emerging Europe.
Global Economy: Evidence has shown that global economic conditions have improved, and global growth has been slightly more robust than initially expected. The global economy should grow around 2% this year. Lower commodity prices and improving supply chain dynamics should see global inflation fall quickly, enhancing consumer purchasing power.
Core inflation in the Eurozone hit a record in March, a setback for central bankers whose rapid interest-rate rises have exacerbated financial sector strains and caused pain in part of the bloc’s economy. Consumer prices were 6.9% higher in March than a year earlier. This increases the likelihood that the European Central Bank will raise its key rate again in May. It could also encourage governments to explore alternative ways to cool price rises by targeting inflationary profit increases.
China’s economy rebounded in the first three months of 2023 after Beijing dismantled its heavy-handed Covid-19 controls, teeing up a revival in growth that could buoy the global economy as the U.S. and European economies slow. China's economy expanded by 4.5% in the first quarter of the year compared with the same three months a year earlier. Chinese consumers drove growth. The economy has also benefited from government investment in infrastructure and a surprise pickup in exports in March.
Outlook: The U.S. economy has continued to expand, albeit relatively sluggishly. Consumer spending, the primary driver of growth, and hiring were surprisingly strong at the start of 2023. Still, they more recently slowed as the Federal Reserve has continued raising interest rates to cool the economy and curb rapid price increases.
Consumers cut retail spending in February and March. Home sales and manufacturing output dropped in March, and robust hiring growth eased.
Fed tightening in May should exert further headwinds on the economy. Additionally, the cash stockpiles consumers have accumulated over the past few years are gradually being eroded. Real personal consumption expenditures will likely decelerate in the coming months, lowering headline GDP growth.
Growth could average about 1.3% in 2023 and just 1.0% in 2024. Weaker economic growth should soon begin to weigh on hiring intentions – putting upward pressure on the unemployment rate. The unemployment rate should rise by more than one percentage point between Q1-2023 and Q4-2024, reaching a peak of 4.5%-5.0%, before gradually moving back to its long-run average of 4%.
Inflation has slowed from its multi-decade highs, though more recent data has shown some stalling in the disinflation process. The fed funds rate could reach 5.25% in Q2-2023 and remain at that level through the fourth quarter of 2023. As higher rates cool demand-side pressures and inflation moves meaningfully back towards 2%, the Fed will be able to cut interest rates back to a level more consistent with its neutral (2.5%) rate.
Sources: Department of Commerce, Department of Labor, Bloomberg, Peoples Bank of China, Eurostat, Institute for Supply Management, National Association of Realtors
Disclosures:
Past performance quoted is past performance and is not a guarantee of future results. Portfolio diversification does not guarantee investment returns and does not eliminate the risk of loss. The opinions and estimates put forth constitute our judgment and are subject to change without notice, as are statements of financial market trends, which are based on current market conditions. We believe the information provided here is reliable, but do not warrant its accuracy or completeness. This material is not intended as an offer or solicitation for the purchase or sale of any financial instrument. The views and strategies described may not be suitable for all investors. This material has been prepared for informational purposes only, and is not intended to provide, and should not be relied on for, accounting, legal or tax advice. References to future returns are not promises or even estimates of actual returns a client portfolio may achieve. Any forecasts contained herein are for illustrative purposes only and are not to be relied upon as advice or interpreted as a recommendation.
Securities are not insured by FDIC or any other government agency, are not bank guaranteed, are not deposits or a condition to any banking service or activity, are subject to risk and may lose value, including the possible loss of principal.
Atlantic Union Bank Wealth Management is a division of Atlantic Union Bank that offers asset management, private banking, and trust and estate services. Securities are not insured by the FDIC or any other government agency, are not deposits or obligations of Atlantic Union Bank, are not guaranteed by Atlantic Union Bank or any of its affiliates, and are subject to risks, including the possible loss of principal. Deposit products are provided by Atlantic Union Bank, Member FDIC.